Marketing teams rarely suffer from a shortage of metrics. They suffer from weak relationships between metrics and decisions. A dashboard can show traffic, impressions, engagement, leads, and revenue while leaving the team unsure what to change.
A measurement framework solves that problem by connecting activity to customer progress and business value. It also exposes where the data cannot support the claim being made.
Begin with the decision, not the dashboard
Write down the business question first. Examples: Which channel produces qualified pipeline? Why is consultation conversion falling? Which content influences evaluation? Is paid search acquiring profitable customers? Where does the customer journey lose momentum?
Then choose the minimum set of metrics needed to answer it. Connect the framework to the digital strategy and one planning outcome.
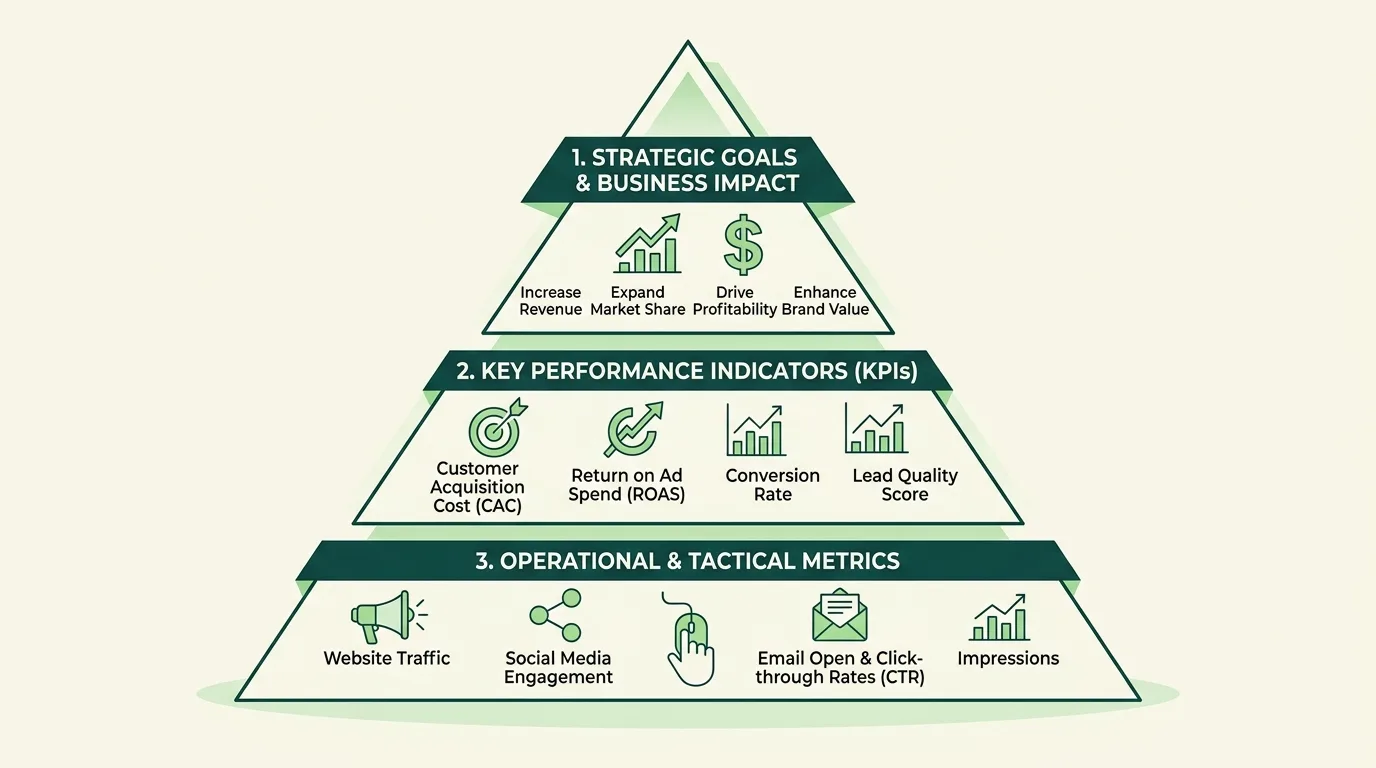
Level 1: Business outcomes
These measures describe value created for the business: profitable revenue, qualified pipeline, customer acquisition cost, retention, lifetime value, contribution margin, market penetration, or cost to serve.
Use definitions the finance and operating teams recognize. Revenue without margin can hide expensive growth. Pipeline without qualification can hide poor lead quality.
Level 2: Decision indicators
These measures show whether customers and commercial processes are moving toward the outcome. Examples include qualified-lead rate, consultation-to-proposal conversion, proposal-to-win rate, average sales cycle, repeat purchase, activation, response time, and assisted conversions.
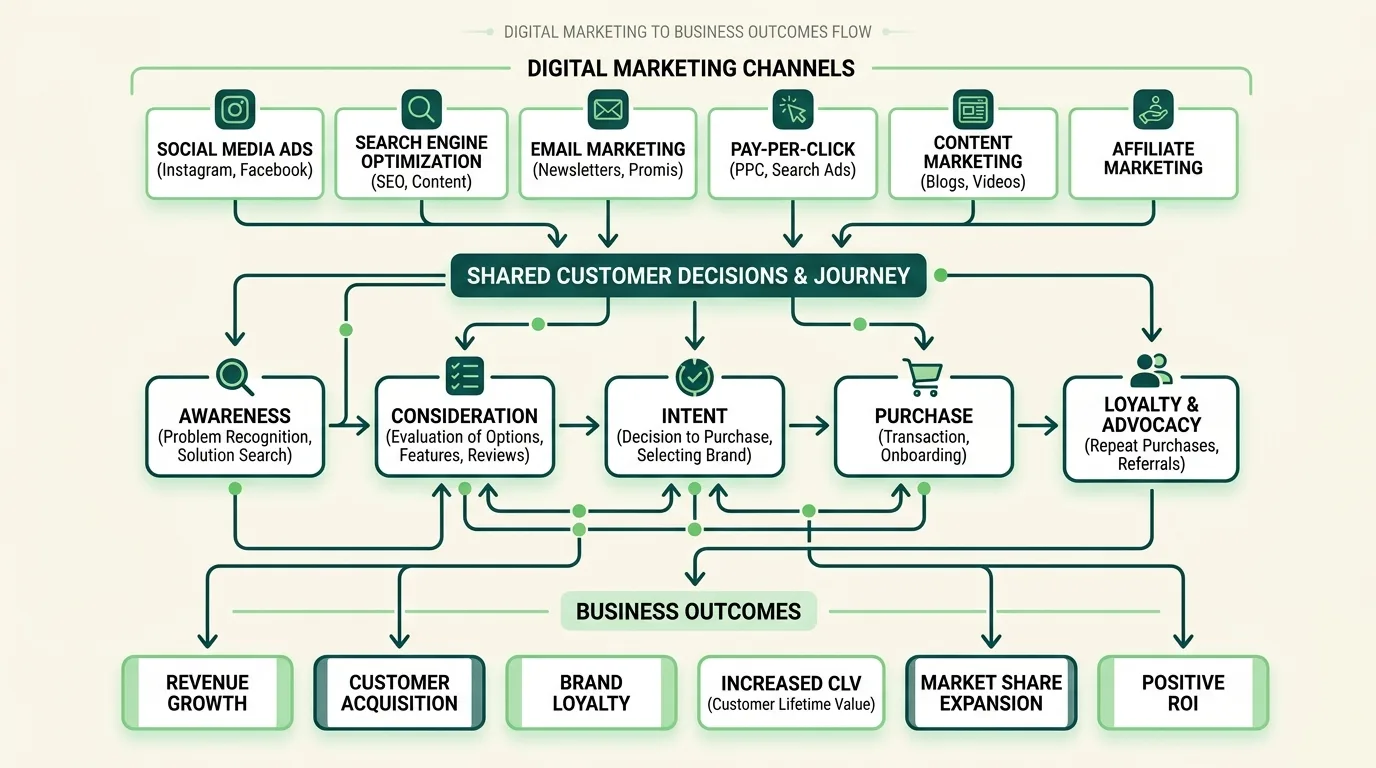
Decision indicators help explain why an outcome changed. They are especially useful across the customer journey because they reveal weak transitions.
Level 3: Channel and operational diagnostics
These measures help teams optimize execution: non-brand impressions, ranking coverage, click-through rate, cost per click, watch time, email click rate, page speed, form completion, publishing cycle time, and lead-routing errors.
Diagnostic metrics matter, but they are not the business result. More traffic is not automatically better. Lower cost per lead is not automatically better if lead quality falls.
Build a metric specification
For every KPI, document:
- Business question answered
- Exact definition and formula
- Inclusion and exclusion rules
- Data source and system owner
- Update frequency
- Baseline and target range
- Known limitations
- Decision threshold
- Person accountable for action
This prevents teams from using the same label for different calculations. It also makes tracking changes auditable.
Measurement by channel
SEO and AI discovery
Track indexable coverage, non-brand impressions, qualified organic visits, conversions, assisted conversions, pipeline, and cited visibility where platforms provide it. Use AI SEO services to connect search and AI discovery without inventing unsupported attribution.
Track search-term quality, verified conversions, cost per qualified lead, close rate, acquired margin, and incrementality where test design permits. Challenge platform-only reporting to ensure accurate return on ad spend (ROAS).
Content
Track discoverability, engaged qualified visits, assisted conversion, sales use, backlinks, updates, and topic-level outcomes. Avoid judging every article by direct last-click revenue.
Social
Track watch time, qualified engagement, saves or shares where relevant, profile actions, referral quality, lead capture, and brand-search movement. Metrics should match the channel’s assigned role.
Website and conversion
Track task completion, conversion rate by intent, form errors, mobile performance, call quality, lead routing, and response time. Pair analytics with usability and customer evidence.
Attribution without false certainty
Last-click attribution is simple but ignores earlier discovery and evaluation. Multi-touch models distribute credit but depend on identity, tracking, and model assumptions. Platform-reported attribution can count the same customer more than once across systems.
Use attribution as one input. Combine it with controlled experiments, geographic or audience holdouts where practical, matched-market comparisons, CRM outcomes, sales feedback, and customer research. State uncertainty openly.
A useful review cadence
Weekly operating review
Check tracking health, implementation quality, spend pacing, lead routing, anomalies, and customer feedback. Make small operational decisions.
Review outcomes, indicators, channel contribution, budget allocation, experiment results, and capacity. Decide what to scale, stop, or improve.
Quarterly strategy review
Challenge audience, offer, journey, channel, and investment assumptions. Use the 90-day roadmap to translate decisions into owned work.
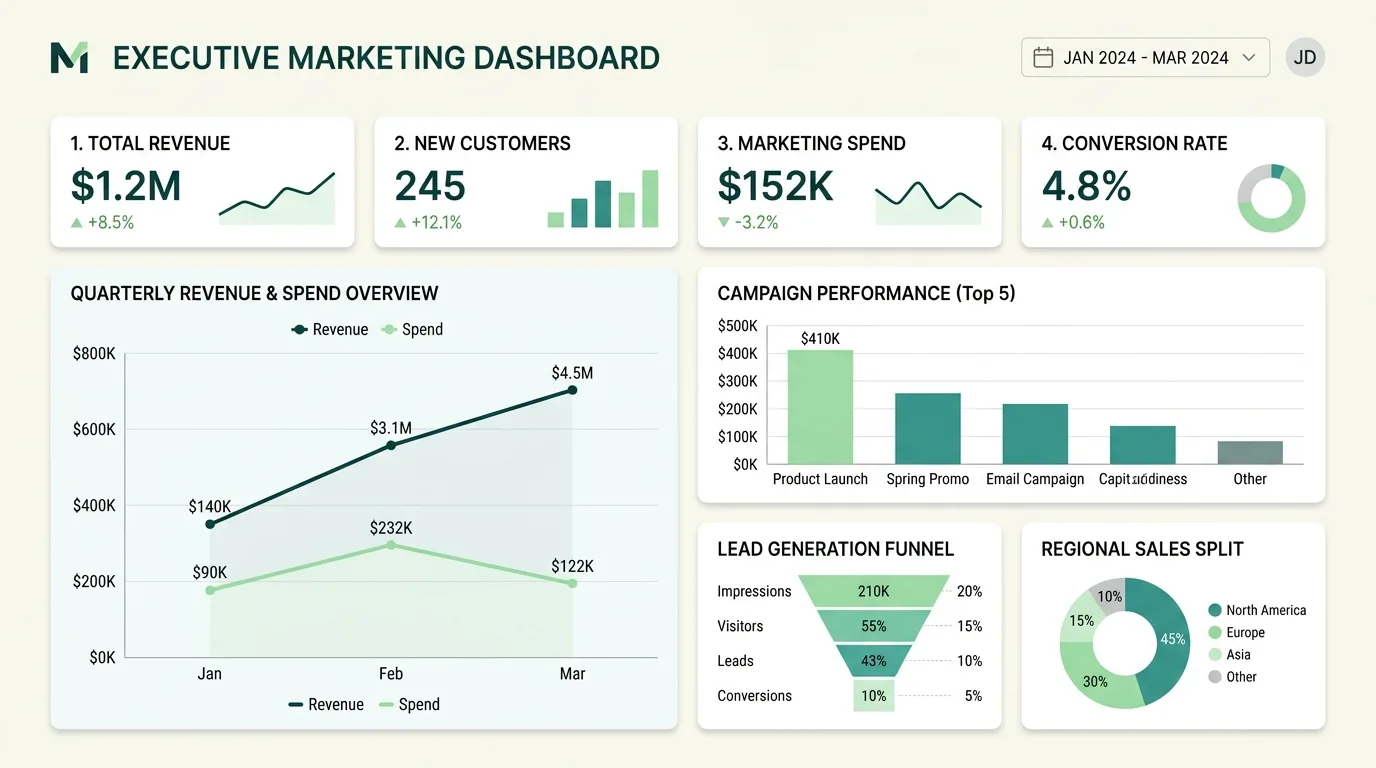
Dashboard design rules
- Show the business outcome first.
- Group metrics by decision, not platform.
- Include definitions and date ranges.
- Separate actuals, targets, and forecasts.
- Surface data-quality warnings.
- Limit each view to a specific audience and purpose.
- Attach actions and owners to material changes.
Common measurement mistakes
- Reporting metrics with no decision owner
- Treating correlation as causation
- Comparing channels with different roles using one attribution view
- Optimizing cost per lead without lead quality
- Changing definitions without documenting the change
- Ignoring consent, tracking loss, and data gaps
- Building dashboards before fixing source data
- Pretending AI citations equal revenue
Frequently asked questions
How many marketing KPIs should a business track?
Track enough to explain the outcome and guide decisions, not every available metric. An executive view may need five to ten measures, while operating teams use deeper diagnostics.
What is the difference between a KPI and a metric?
A metric measures activity or performance. A KPI is a metric selected because it is critical to a defined objective and decision process.
How should AI search visibility be measured?
Use platform citation or referral data where available, search visibility, qualified visits, branded demand, and downstream outcomes. Treat third-party visibility estimates as directional unless their methodology is clear.
Make reporting operational
If reporting is fragmented across analytics, ads, CRM, and manual spreadsheets, explore Microdigm’s workflow automation services, AI agents, or request a measurement review.